A GPU benchmark is useful only when it answers a decision. A single peak-throughput number cannot prove that a new server is healthy, that eight GPUs communicate correctly, that a storage path can feed training, or that an inference service will meet its latency target.
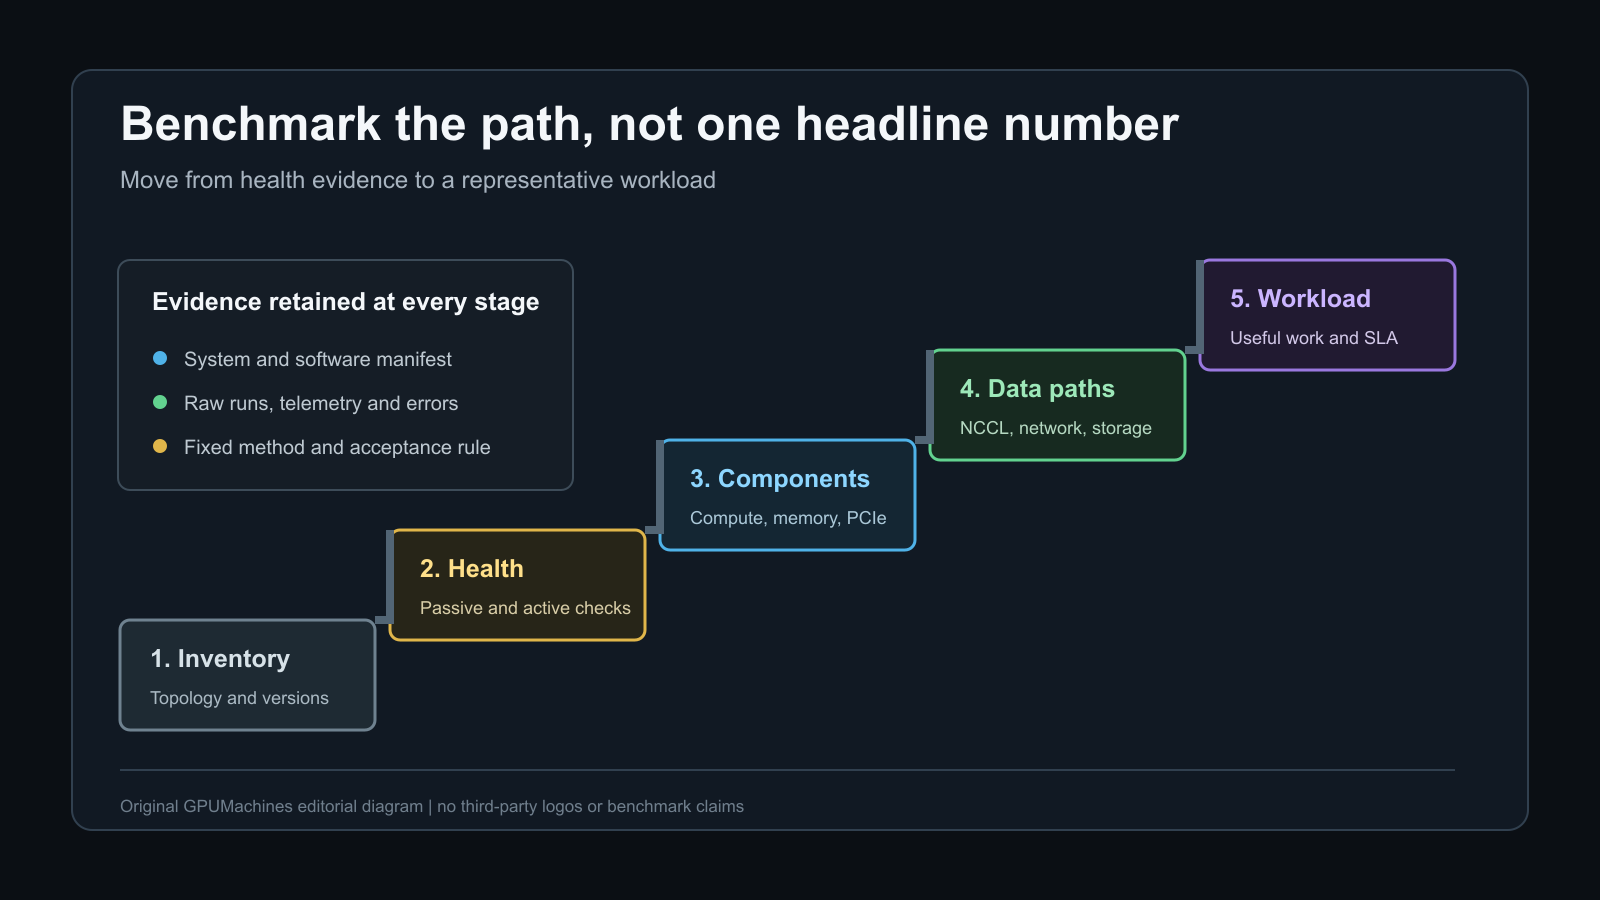
The right approach is a benchmark ladder. Begin with inventory and health evidence, test each important data path, then run a representative workload under controlled conditions. Record enough context for another engineer to repeat the run and explain why two results differ.
This guide sets out what to test, what to record and how to compare results without turning a commissioning exercise into a leaderboard. It is written for buyers and operators accepting a GPU server or cluster, not for publishing a universal score.
Start with the decision, not the tool
Before selecting a benchmark, write the question it must answer. Typical commissioning questions include:
- Did the delivered hardware match the order and initialise correctly?
- Can every GPU sustain a controlled workload without new errors, throttling or unexplained resets?
- Does host-to-device, device-memory and peer-to-peer behaviour look consistent across equivalent GPUs?
- Do collectives use the intended NVLink, NVSwitch, PCIe and network paths?
- Can the storage tier supply the actual dataset shape without hiding behind cache?
- Does the target model meet a defined throughput, latency, accuracy or time-to-result requirement?
- Does adding GPUs or nodes improve useful work enough to justify the extra infrastructure?
These are different questions. They need different tests and evidence. A matrix-multiplication result does not validate checkpoint recovery. An NCCL all-reduce run does not prove inference tail latency. A healthy telemetry screen does not prove that an application can create a CUDA context and complete work.
Write an acceptance statement in plain language. For example: "The eight-GPU node must complete the agreed health suite, show no unexplained GPU-to-GPU outlier, and run the reference training job three times within the agreed variance while remaining inside its approved power and thermal envelope." The values belong in the customer's acceptance plan; this article does not invent them.
Build a benchmark ladder
Use a sequence that narrows problems before the application layer adds complexity.
| Layer | Question | Suitable evidence | What it does not prove | | --- | --- | --- | --- | | Inventory | Is this the ordered system? | GPU, CPU, memory, NIC, drive, firmware and topology records | Performance or stability | | Passive health | Did ordinary operation produce known warnings or failures? | DCGM health watches, XIDs, ECC, link and thermal telemetry | Successful execution under load | | Active diagnostics | Can the installed platform execute controlled subsystem tests? | DCGM diagnostic results and per-entity findings | Application performance or business SLA | | Component performance | Are local compute, memory and transfer paths consistent? | Controlled microbenchmarks with repeated runs | End-to-end workload behaviour | | Collective communication | Do GPUs and nodes exchange data correctly and consistently? | NCCL tests across defined rank and message-size ranges | Model convergence or storage performance | | Storage and data path | Can the intended dataset and checkpoint pattern be served? | Cold and warm reads, metadata tests, checkpoint writes and recovery | GPU compute efficiency | | Representative workload | Does the planned job meet its objective? | Training, inference or scientific workload metrics | Performance of unrelated workloads | | Soak and recovery | Does behaviour remain stable over time and after a controlled interruption? | Long-run telemetry, error logs and restart evidence | Every possible production failure |
Do not skip directly to the most impressive application result. If the result is poor, the team will not know whether the cause is the GPU, power state, CPU affinity, interconnect, network, storage, software stack or workload configuration.
Freeze the system under test
Every result needs a system description. MLCommons requires structured system and software descriptions for formal MLPerf submissions because a score without its hardware and software context is not reproducible. An internal acceptance test can use a lighter record, but it should follow the same principle.
Record at least:
- server vendor, model, serial or asset identifier and node count;
- GPU model, count, memory capacity, form factor and GPU firmware where exposed;
- CPU model, socket count, core configuration, memory population and NUMA layout;
- PCIe topology, negotiated link state, NVLink or NVSwitch topology and network adapters;
- storage devices, filesystems, mount options, shared-storage client and dataset location;
- BMC, BIOS and relevant device firmware versions;
- operating system, kernel, NVIDIA driver, CUDA runtime and toolkit versions;
- Fabric Manager, NCCL, communication plugins and container runtime versions;
- framework, libraries, model revision, container image digest and benchmark commit;
- GPU power limits, application clocks, persistence mode, MIG mode and compute mode;
- CPU governor, memory settings and any deliberate tuning applied for the run;
- scheduler allocation, process placement, CPU affinity, GPU mapping and network-interface selection.
Capture topology from the running system instead of relying only on the bill of materials. Two servers with the same component list can behave differently when GPUs, NICs or NVMe devices attach to different CPU sockets or PCIe switches.
The GPU server network separation guide explains how to identify the management, storage and compute fabrics before multi-node tests. The storage commissioning guide covers the local and shared tiers that can otherwise distort workload results.
Control the operating conditions
Benchmark variance is evidence. It should not be edited away.
Before a run, record whether the node is idle, shared or exclusively allocated. Note background monitoring, security scanning, backup work, storage maintenance and other jobs that can consume CPU, network or I/O resources. Drain the target resources before active diagnostics or stress tests.
Keep the following conditions consistent between comparisons:
- power cap and clock policy;
- fan and cooling policy, inlet conditions and rack position where relevant;
- GPU and CPU placement;
- message sizes, tensor shapes, precision and batch size;
- model weights, dataset revision and preprocessing path;
- number of processes, threads, ranks and GPUs per process;
- warm-up policy, run duration, repetition count and stop rule;
- cache state and storage path;
- client concurrency, request distribution and network location;
- software versions and environment variables that affect library selection.
Warm-up is not a way to improve a result after the fact. It is part of the method. Framework graph capture, kernel compilation, allocator growth, cache population and GPU clock behaviour can make early iterations unrepresentative. Define what is excluded and retain both cold-start and steady-state metrics when startup matters to the buyer.
Do not run until the number looks attractive. Set repetitions and acceptance rules in advance. Retain individual runs, not only an average. The median can describe a typical run; minimum and maximum, percentile ranges or a coefficient of variation can reveal instability. For latency-sensitive services, averages alone are especially weak because they hide the tail.
Separate health from performance
NVIDIA Data Center GPU Manager distinguishes passive health monitoring from active diagnostics. Passive watches interpret retained telemetry while ordinary work runs. Active diagnostics apply controlled tests when the target resource can be taken out of service.
That distinction matters during acceptance:
- A passive "healthy" result means that enabled rules found no incident in the retained samples. It does not prove that every subsystem was watched or that a stress test passed.
- An active diagnostic pass applies to the selected test, entities, software environment and run conditions. It does not prove application throughput.
- A warning, skip or setup error is not the same as a hardware failure. Retain the per-entity status, error category and message.
NVIDIA documents quick, medium, long and extra-long diagnostic suites, plus named tests for areas such as software deployment, memory, PCIe, compute, power and bandwidth. Suite composition and test availability vary with the DCGM release, installed plugins and hardware. Record the exact suite or named tests rather than writing only "DCGM passed".
Longer diagnostics can consume compute, memory, PCIe, NVLink, CPU, power and cooling capacity. Run them only on drained resources and preserve the output. A later article in this series covers DCGM commissioning in detail.
Test compute and memory as components
Component tests help identify a weak device or path before the full workload is involved. They should be treated as probes, not a synthetic promise of application speed.
Useful component questions include:
- Can every GPU create a context and complete a controlled compute workload?
- Is device-memory behaviour consistent across equivalent accelerators?
- Are host-to-device and device-to-host transfers using the expected PCIe path?
- Is peer access available where the topology says it should be?
- Does sustained work introduce correctable errors, throttling, clock collapse or thermal instability?
Compare like with like. The same GPU model in a different form factor, power envelope or topology may have a different expected result. Peak specifications are ceilings under defined conditions, not acceptance values. NVIDIA's performance guidance explains that workload behaviour can be limited by mathematical throughput, memory bandwidth or latency depending on arithmetic intensity and available parallelism. A single "GPU utilisation" percentage cannot identify which limit applies.
Record the input type, precision, dimensions, memory-transfer direction, allocation method, iteration count and timing method. If a tool reports a derived throughput, retain the raw elapsed time and problem size as well. Watch power, clocks, temperature, memory errors and link counters alongside the score.
An outlier should trigger investigation, not an immediate replacement decision. Confirm placement, affinity, power state, thermal state and background activity. Repeat the same test after returning the node to the baseline configuration. If the outlier follows the physical device rather than the slot or workload placement, the evidence becomes more useful to the vendor.
Measure collectives with the topology attached
For multi-GPU and multi-node systems, NCCL tests are commonly used to exercise collective communication. The result is meaningful only when the rank layout, topology and selected interfaces are recorded.
Test at least the collectives used by the intended workload. All-reduce is important for many distributed-training jobs, but all-gather, reduce-scatter, broadcast and point-to-point behaviour may also matter. Use a message-size range because small transfers expose latency and launch overhead while large transfers show sustained bandwidth behaviour.
NCCL tests report operation time plus algorithm bandwidth and bus bandwidth. The official performance note defines algorithm bandwidth as message size divided by elapsed time. Bus bandwidth applies a collective-specific factor intended to reflect traffic on the communication path. These columns are not interchangeable, and the factor varies by collective and rank count.
Record:
- NCCL and nccl-tests versions or commits;
- collective, data type, reduction operation and root where applicable;
- minimum and maximum message size and size progression;
- number of nodes, ranks, processes, threads and GPUs per process;
- in-place or out-of-place mode;
- GPU-to-rank mapping and CPU affinity;
- NCCL-selected algorithm and protocol where captured;
- selected NICs, GPU Direct RDMA path and relevant transport plugins;
- topology files, environment overrides and full stdout or structured output;
- operation time, algorithm bandwidth, bus bandwidth and validation errors.
Do not compare a single-node eight-GPU result with a two-node result as if only the GPU count changed. The second run introduces network paths, adapters, switches, routing, CPU placement and possibly a different NCCL algorithm. Compare each run with an agreed baseline for the same topology and configuration.
Correctness remains the first gate. A high bandwidth line beside validation errors is not a pass. Inspect link and network telemetry during the run so a fallback path does not masquerade as acceptable performance.
Profile the workload after the platform passes
Once the lower layers are credible, run a workload that represents the purchasing decision. Use the same model, precision, sequence length, image size, batch policy, dataset representation and convergence or accuracy requirement expected in production.
For training, useful measures can include:
- examples, samples or tokens processed per second;
- step time and its distribution after warm-up;
- time to a stated quality target where the method supports it;
- scaling efficiency from one GPU to multiple GPUs and nodes;
- time spent loading data, synchronising, evaluating and checkpointing;
- useful work completed per unit of energy when power is part of the decision;
- restart time and the amount of work lost after a checkpoint recovery test.
For inference, define the service scenario before measuring. Throughput without latency constraints can reward an unusable queue. Record concurrency or request rate, input and output distributions, batching, streaming behaviour and latency percentiles. For generative models, token throughput, time to first token and inter-token latency answer different user-experience questions. They should not be collapsed into one headline number.
NVIDIA Triton Performance Analyzer supports different load modes and repeated measurement windows intended to establish stable results. Those features do not remove the need to define realistic inputs and service objectives. A server can appear efficient with synthetic zero data or an easy request distribution and behave differently with production prompts or tensors.
Use low-overhead telemetry to locate imbalance, then a developer profiler when attribution is required. DCGM profiling exposes interval averages for areas such as SM, memory, PCIe and NVLink activity. NVIDIA notes that these are not kernel traces. Nsight Systems can show CUDA API activity, memory operations, kernel execution and other traced libraries on a timeline. Profiling adds overhead and can contend for hardware-counter resources, so record whether it was enabled and do not mix profiled and unprofiled results without labelling them.
Benchmark storage without letting cache write the story
Dataset and checkpoint performance can dominate an otherwise healthy GPU system. Measure the path the workload will actually use, including local cache, shared storage, network and metadata services.
Separate at least four cases:
1. cold access to data not already in the relevant cache; 2. warm access after cache population; 3. concurrent access from the planned number of nodes or jobs; 4. checkpoint write, completion, visibility and recovery.
Record file count, file-size distribution, total data volume, read/write mix, transfer size, queue depth, client count, mount options and cache state. A sequential read of one large file cannot stand in for millions of small training samples. A temporary local copy cannot stand in for durable checkpoint completion.
Watch GPU idle time, CPU usage, network traffic, storage latency and metadata operations during the workload. If accelerators wait for data, a faster GPU score does not solve the business problem.
Compare systems without moving the goalposts
A valid comparison changes one intended variable at a time or clearly discloses all differences. Keep a comparison table beside the results:
| Dimension | Baseline | Candidate | Comparable? | | --- | --- | --- | --- | | Hardware and topology | Recorded configuration | Recorded configuration | Yes only if differences are relevant and disclosed | | Software stack | Pinned versions | Pinned versions | Explain every change | | Workload and data | Same revision and inputs | Same revision and inputs | Required for direct comparison | | Power and clock policy | Recorded | Recorded | Required for efficiency claims | | Placement and concurrency | Recorded | Recorded | Required for scale claims | | Warm-up and measurement | Fixed method | Fixed method | Required | | Accuracy or quality | Stated threshold | Stated threshold | Required for useful work comparisons |
Normalise only when the normalisation helps the decision. Per-GPU throughput can reveal scaling loss, but it can also hide the absolute capacity a buyer needs. Performance per watt requires an agreed power boundary. Performance per pound needs a consistent price basis, support term and infrastructure scope. State whether the calculation includes only accelerators, the server, network and storage, or the complete deployed service.
Do not compare a vendor's best published result with an internal default configuration and call the difference a hardware gap. Published MLPerf results are valuable because they include system descriptions, code and submission rules, but they remain results for specific systems and benchmark versions. Use them as evidence, not as a substitute for testing the purchased configuration.
Define acceptance and escalation before the run
An acceptance plan needs more than a target number. Define:
- mandatory tests and permitted skips;
- the baseline source and tolerance for equivalent devices or nodes;
- maximum run-to-run variance;
- disqualifying correctness, ECC, XID, link, thermal or reset events;
- the response to a warning versus a failure;
- when a rerun is allowed and what must be unchanged;
- evidence required for vendor escalation;
- who signs off compute, network, storage and workload results.
Keep the first failure state. Logs rewritten by a later successful run can remove the most useful evidence. Preserve timestamps in one time base and collect the node, GPU UUID, rank and process mapping so events can be correlated.
If a test fails, move down the ladder. Confirm inventory and topology, then health, diagnostics, component paths, collectives, storage and finally the application. Change one factor, record the change and repeat the smallest test that can confirm or reject the hypothesis.
Build the final evidence pack
A buyer should receive a compact evidence pack rather than screenshots of isolated scores. Include:
- the acceptance questions and signed test plan;
- immutable system and software manifests;
- topology, power, clock and placement records;
- complete commands or configurations with secrets removed;
- raw outputs and structured logs;
- individual run results plus the declared summary statistic;
- telemetry covering warm-up, measurement and cool-down;
- observed errors, warnings, skips and approved deviations;
- comparison tables and calculations;
- a conclusion tied to the stated workload and acceptance rule.
Redact credentials, internal addresses, user names, customer data and confidential model or dataset paths before sharing the pack. Do not remove technical context needed to interpret a result.
The most useful conclusion is often narrow: "This configuration met the agreed eight-GPU training acceptance test under the recorded software, power, topology and data conditions." That is stronger than claiming the server is universally fast.
To turn the test matrix into a procurement or commissioning specification, add the intended GPU count, interconnect, network, storage and workload constraints to the GPUMachines cluster configurator. The resulting discussion can define which results matter before hardware and acceptance criteria are fixed.
Sources and Further Reading
- NVIDIA DCGM documentation
- NVIDIA DCGM health monitoring
- NVIDIA DCGM diagnostics
- NVIDIA DCGM profiling
- NVIDIA NCCL tests performance definitions
- NVIDIA Nsight Systems User Guide
- NVIDIA GPU Performance Background User's Guide
- NVIDIA Triton Performance Analyzer
- MLCommons general MLPerf submission rules