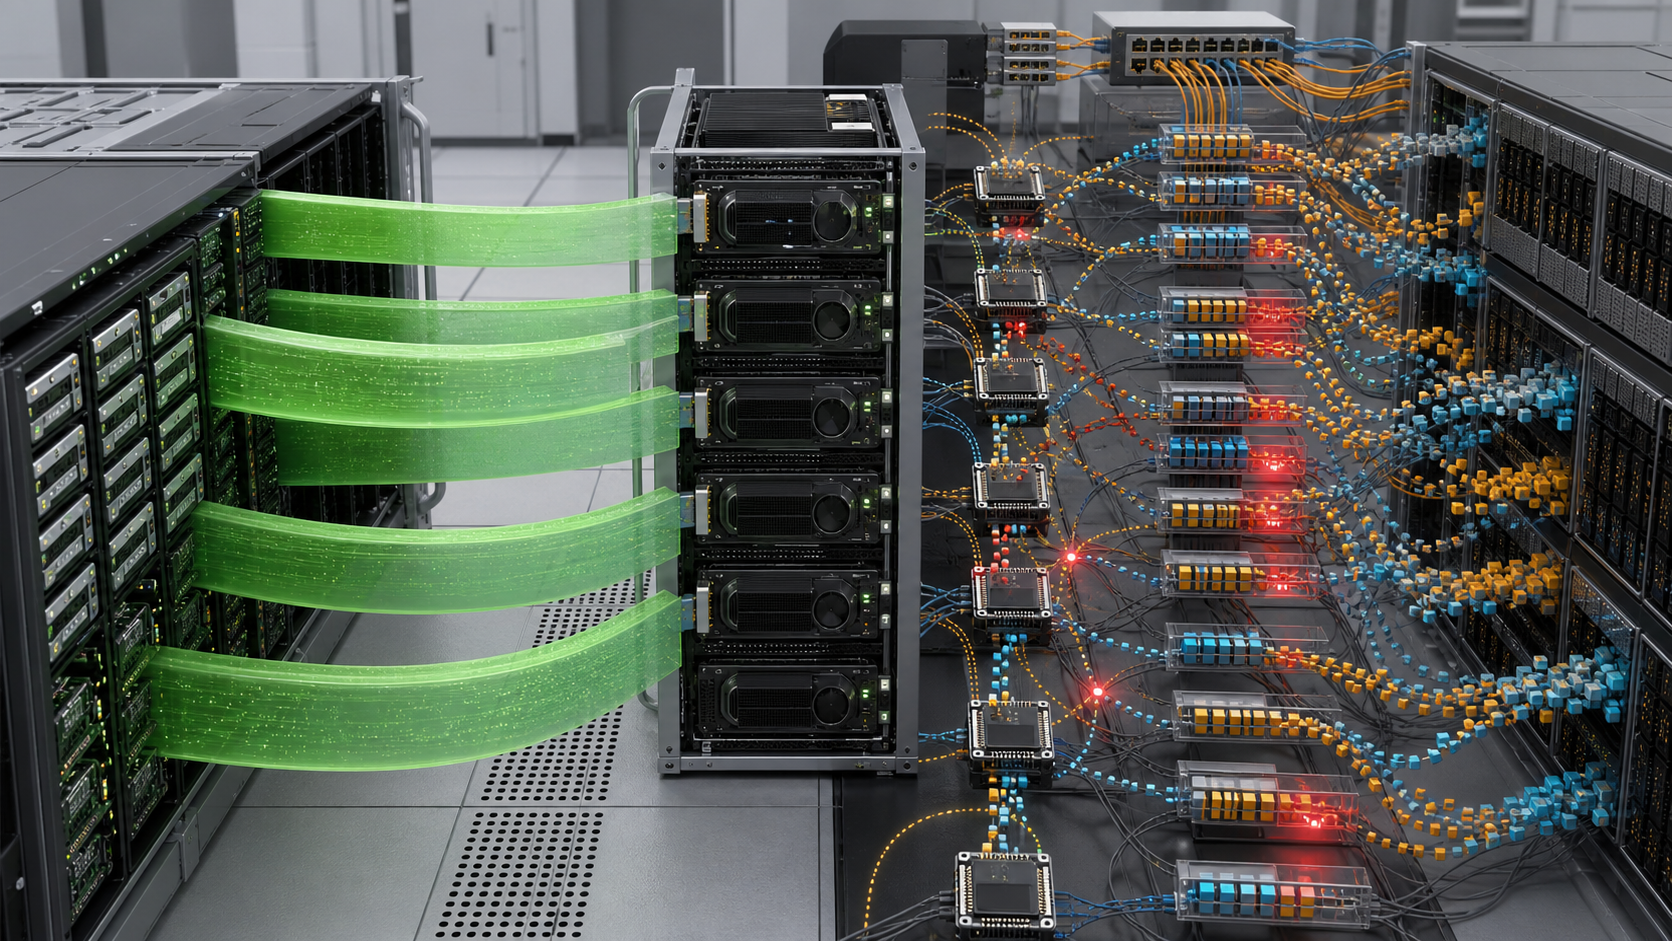
A storage array can win a benchmark and still leave expensive GPUs waiting. The usual culprit is simple: the benchmark measured a clean sequential stream while the real job issued many smaller, concurrent and metadata-heavy requests.
This gap is becoming harder to ignore. The 2026 Future of Memory and Storage conference programme included work on 512-byte operations for very high-IOPS solid-state storage. NVIDIA has also discussed GPU-initiated fine-grained I/O and new context-memory storage for inference. These are vendor and conference signals, not proof that every AI workload has suddenly become a 512-byte IOPS test. They do show why one aggregate GB/s number is no longer a sufficient purchasing criterion.
AI infrastructure buyers need a test method that follows data from storage into useful accelerator work. That means measuring transfer size, concurrency, queue depth, tail latency, metadata, cache state and recovery alongside throughput.
This guide explains how to write that test and how to spot a benchmark designed to flatter the product rather than answer the buying question.
The short answer
Sequential GB/s still matters. Large training shards, checkpoints and model files can generate sustained transfers, and a storage system that cannot deliver enough bandwidth will limit a cluster.
It is not enough because AI platforms also perform work that looks very different:
- Many workers may open files or objects at the same time.
- Training pipelines may issue small reads after shuffling or sampling.
- Checkpoint writes can arrive as coordinated bursts.
- Inference services may load model segments and move KV-cache or context data under tight latency targets.
- GPU-initiated I/O can change request granularity and remove CPU aggregation that previously made traffic look larger and smoother.
- Multi-tenant clusters add background data preparation, scans, logging and artefact access.
The correct procurement target is not “maximum bandwidth”. It is storage behaviour under the workload mix that keeps the planned GPUs productive.
GPUMachines can help buyers connect that test to a scale-out storage and GPU cluster design, including client count, fabric and failure scenarios.
Why the familiar headline is attractive
GB/s is easy to understand. It can be measured with large sequential transfers, scales visibly as drives and nodes are added, and maps neatly to network link rates. Vendors can produce a single impressive result and buyers can compare two numbers.
The test can still be useful when its conditions match the workload. A training dataset stored in large contiguous shards may stream efficiently. A checkpoint can be a large sequential write. A model repository may distribute large files to inference nodes.
Problems start when the result is treated as a universal rating. Large-block sequential tests minimise metadata work, reduce command overhead and can benefit from read-ahead, write buffering and cache. They may use a small number of well-behaved clients. Real clusters combine thousands of workers, changing access patterns and competing services.
A 100 GB/s result does not state how long an individual 64 KiB request waits, how the namespace behaves during a job launch, or what happens when a storage node rebuilds. It may not even show whether the network, clients or storage media set the limit.
There is no single AI storage workload
“AI workload” is too broad for a benchmark profile. Buyers should map the data path by stage.
Ingest and preparation
Raw data may arrive as large objects, database exports, archives or huge collections of small files. Preparation jobs decode, filter, transform, deduplicate and write new shards. CPU, metadata and write amplification can matter as much as read bandwidth.
Training
Training workers read samples repeatedly. Format and shuffling strategy determine whether those reads are large and sequential or smaller and scattered. Distributed jobs can synchronise storage demand at epoch boundaries or after a restart. Local caches may hide the shared system after the first pass, which is useful operationally but dangerous if a benchmark reports only the warm run.
Checkpoint and recovery
Checkpointing produces writes from many workers and often includes metadata updates. The business measure is how much training time is lost to the checkpoint and how quickly a failed job can restart. Peak write throughput does not capture coordination or namespace delay.
Fine-tuning and research
Many smaller jobs can create more metadata and random access than one large run. Researchers may duplicate environments, create temporary artefacts and scan datasets. Aggregate bandwidth may be modest while user-visible latency is poor.
Inference
Inference storage ranges from occasional model loading to frequent movement of embeddings, context and cache data. NVIDIA’s CMX description presents a storage tier for long-context and agentic inference, including ephemeral KV-cache data. Whether that architecture applies to a buyer depends on the serving engine, memory hierarchy and service-level target.
The benchmark suite should include only the stages the organisation will operate, but it should not collapse them into an average.
Small I/O is not automatically the new target
The Future of Memory and Storage agenda referenced fine-grained 512-byte I/O in research on high-IOPS SSDs. NVIDIA’s GTC session on “Storage Next” described GPU-initiated I/O at similar granularity and reported a research result near 98 million 512-byte IOPS on an H100 test environment. That number belongs to the reported session conditions. It is not a general array target, an independent benchmark or a purchasing requirement for every GPU cluster.
Why discuss it at all? Because it exposes a direction of travel. When the GPU can request data directly and the application accesses fine-grained state, aggregating everything into large CPU-managed transfers may add delay or movement. A storage and interconnect stack optimised only for large blocks may behave differently.
Buyers should first trace their software. Does the framework issue fine-grained reads? Does a library combine them? Is data cached in host memory or local NVMe? Does the shared storage ever see the 512-byte operation, or does it receive a larger request after aggregation?
Benchmark the request size that reaches each layer. Do not force a 512-byte test merely because it is current. Equally, do not dismiss small-block performance without checking the path.
IOPS needs latency and queue depth
An IOPS number without queue depth is incomplete. A system can achieve a large aggregate rate by holding many requests in flight while individual requests wait too long for the application.
Record average latency and percentiles such as p95, p99 and p99.9. Tail latency matters when thousands of workers must reach a barrier. A small group of delayed readers can hold back an entire distributed step.
Run several queue depths. Low queue depth shows responsiveness when the application cannot issue much parallel work. High queue depth shows maximum concurrency and where saturation begins. Plot throughput and latency together. The useful operating point is before latency rises sharply, not necessarily the highest IOPS sample.
Use enough clients to represent the cluster. One powerful benchmark host may not expose client software, network fan-in or metadata contention. At the same time, an unrealistic client storm can test a failure mode the production system will never create. Document the reason for each level.
Metadata can be the hidden limit
Datasets made of small files stress path lookup, open, close and directory operations. Job launches can create a burst as workers inspect environments, manifests and checkpoints. A system may deliver excellent data bandwidth once files are open while taking too long to reach that state.
Measure file creates, stats, opens, closes, renames and deletes under realistic directory layouts. Include concurrent access from several tenants. Record client-visible latency, not only operations reported by a metadata service.
Object storage changes the interface but does not remove metadata. Listing, authentication, bucket policy, object lookup and small-object overhead can still control performance. Test the API calls the application actually uses.
Dataset packaging can be a better fix than buying more metadata hardware. Converting millions of tiny files into well-sized shards may improve efficiency across storage, network and CPU. Procurement should allow application changes to be compared with infrastructure changes, provided reproducibility and access needs remain intact.
Cache can make a test lie in either direction
A warm-cache result may show how repeated epochs behave after data is resident. A cold-cache result may show first-run and restart performance. Both can be valid; neither should be presented without its state.
Record caches at every layer: application, client, operating system, local NVMe, storage node and controller. State what was cleared and how. A test that “drops caches” on clients but leaves the storage tier warm is not cold.
Do not disable a cache that production will depend on merely to create a purer array test. Instead, run component and end-to-end profiles. Component tests explain the storage system. End-to-end tests show what the GPUs receive.
Capacity pressure changes cache behaviour. A new system with a small test dataset can appear fast because everything fits in flash or memory. Run a working set large enough to exceed the intended fast tier and observe eviction, refill and recall.
Measure the accelerator outcome
Storage counters should be correlated with job counters. Record accelerator utilisation, data-loader wait, step time, tokens or samples processed and checkpoint pause. The goal is to identify when additional storage performance stops improving completed work.
This is especially important for “GPU starvation” claims. Low accelerator utilisation can come from storage, preprocessing, network collectives, host memory, synchronisation or the model itself. A storage purchase cannot fix a slow tokenizer or an imbalanced distributed job.
Run a controlled progression. Begin with local or synthetic data to estimate the compute ceiling. Add the production data path. Change one storage variable at a time. Compare worker wait states and application throughput.
The GPUDirect Storage overview is relevant where supported software can move data more directly between storage and GPU memory. It does not eliminate filesystem, network, media or application limits. Validate the exact client and device path.
Network and storage must be tested together
A storage system cannot deliver more useful remote throughput than the client and fabric allow. Check link speed, NIC placement, PCIe topology, switch oversubscription, routing and congestion.
Shared Ethernet fabrics need tests with compute collectives and storage active together. A fabric that performs well for each traffic type separately may suffer when bursts overlap. Lossless settings, congestion control and queue allocation require validation under the proposed topology.
Separate storage networks can improve isolation but add ports, switches, optics and operations. Converged designs can use capacity efficiently but demand disciplined traffic engineering. The choice should follow measured failure and congestion behaviour.
Client scaling is often non-linear. Adding storage nodes may not help if clients have one limited link or if the namespace service is saturated. Ask vendors to identify the expected bottleneck at each test point. A response that promises linear scaling indefinitely should be treated cautiously.
Failure tests belong in the benchmark
Production storage spends some of its life degraded, rebuilding, rebalancing or being upgraded. Acceptance should include those states.
Remove a drive, storage node, link and metadata service component according to the supported procedure. Measure application latency, bandwidth, errors and recovery time. Confirm that jobs receive correct failures or continue safely.
Test a checkpoint during degradation. Test a cold model load while the system rebuilds. Measure how background protection work is throttled and how long the risk window lasts.
Durability claims need separate review. Erasure coding, replication and snapshots affect capacity, write cost and recovery. A benchmark tuned for maximum speed may use a protection mode that the buyer would not accept. Require production protection settings in the main result.
Upgrades are another failure-like state. Ask how clients, servers and firmware are updated and whether the process interrupts jobs. A short benchmark cannot answer that, so references and contractual procedures matter.
A procurement benchmark matrix
The tender should provide a matrix rather than one threshold. A practical suite may include:
| Test | Workload shape | Measures that matter | |---|---|---| | Large training read | Large shards, many clients, controlled cache states | Sustained GB/s, worker wait, accelerator utilisation | | Fine-grained read | Application-relevant small blocks and queue depths | IOPS, p99 latency, saturation point | | Metadata launch | Real directory or object layout, concurrent workers | Open/list/stat latency, launch completion | | Checkpoint burst | Proposed model and worker count | Pause time, write completion, interference | | Restart | Cold and warm states after interruption | Time to resume useful work | | Inference model load | Concurrent service replicas | Load time, tail latency, cache pressure | | Mixed tenancy | Training, preparation and inference together | Isolation, service-level compliance, fairness | | Degraded mode | Supported component failures and rebuild | Impact, recovery time, errors, data safety |
For each test, publish client count, block or object size, queue depth, read/write mix, working-set size, cache state, protection mode, software versions and topology. Without this metadata, later comparisons will be unreliable.
Set minimum pass criteria and scored targets. A system that fails correctness, durability or recovery should not compensate with higher throughput.
Questions to ask a storage vendor
Ask where the quoted result was measured: media, controller, storage client or application. Request the full configuration and software versions. Confirm whether compression, deduplication or data reduction affected the number.
Ask how performance changes when the working set exceeds cache, capacity passes normal operating thresholds and a node rebuilds. Request latency distributions, not averages.
Ask which client CPU and memory resources are consumed. A storage stack that takes many host cores may reduce resources available for data preparation or inference. If GPU-direct paths are proposed, request a supported-component matrix and a working demonstration.
Ask for the smallest configuration that can meet the target and the expansion unit required later. Scaling by large fixed increments can create poor economics even when the maximum platform is fast.
Finally, ask what the system should not be used for. A technically serious supplier should be able to describe weak workload shapes and operating limits.
Open-source and commercial platforms
The benchmark method should not favour a commercial appliance or an open-source file system. Ceph, Lustre, DAOS, WEKA, DDN, VAST Data and other approaches make different trade-offs in metadata, data placement, client software, operations and support.
Open-source software can offer control and avoid licence cost, but engineering, tuning, upgrades and incident ownership still cost money. Commercial platforms can provide integrated support and features, but buyers need contract clarity and an exit plan. The parallel file-system buying guide provides a broader comparison.
Use the same production-shaped tests for each viable option. Allow vendors or integrators to tune their systems within a documented period. Keep every configuration change in the final record.
Frequently asked questions
Is GB/s now irrelevant for AI storage?
No. Large sequential transfers remain important for datasets, checkpoints and model files. The point is that throughput must be combined with latency, IOPS, metadata and application results.
Should every buyer test 512-byte I/O?
No. Test it when the application or proposed GPU-initiated path produces that request size. Otherwise use the sizes observed in the real stack. The current research is a reason to measure, not a universal target.
What latency percentile should be specified?
Use the percentile that maps to the service risk. Distributed training barriers and inference targets often make p99 or higher useful. Report the whole distribution when possible and define the measurement point.
How do we prove storage is starving GPUs?
Correlate accelerator utilisation and data-loader wait with storage and network telemetry. Compare against a local or synthetic-data baseline. Low utilisation alone does not identify storage as the cause.
Can local NVMe replace shared storage?
It can cache or stage active data and reduce repeated reads. Shared durable storage is still needed for authoritative datasets, checkpoints and collaboration in most clusters. Node loss and cache refill must be planned.
Does GPUDirect Storage guarantee faster training?
No. It can shorten a supported data path, but gains depend on software, transfer shape, storage, network and the existing CPU bottleneck. Test the full workload.
Can GPUMachines run a storage qualification exercise?
GPUMachines can help define the client, network, storage and workload matrix, source suitable platforms and review results. Final acceptance should use the buyer’s data shape, software and service targets.
Verdict
Sequential throughput remains a useful measurement. Treating it as the storage answer is the mistake.
The next generation of AI storage tests must account for fine-grained I/O, concurrency, metadata, tail latency, cache state and degraded operation. Above all, they must show whether the storage path improves completed accelerator work.
A buyer who writes that evidence into the tender is less likely to overpay for a headline number or underspecify an invisible bottleneck. To build such a test, ask GPUMachines to review the storage, client and network design against the workloads the cluster will actually run.
Sources and Further Reading
- Future of Memory and Storage 2026 agenda - conference programme including fine-grained high-IOPS storage research.
- NVIDIA GTC session: The New AI Storage Paradigm - vendor-reported Storage Next research; results are specific to the described test.
- NVIDIA BlueField-4 STX and CMX context memory storage - official product and workload description.
- NVIDIA GPUDirect Storage overview - official architecture documentation.